

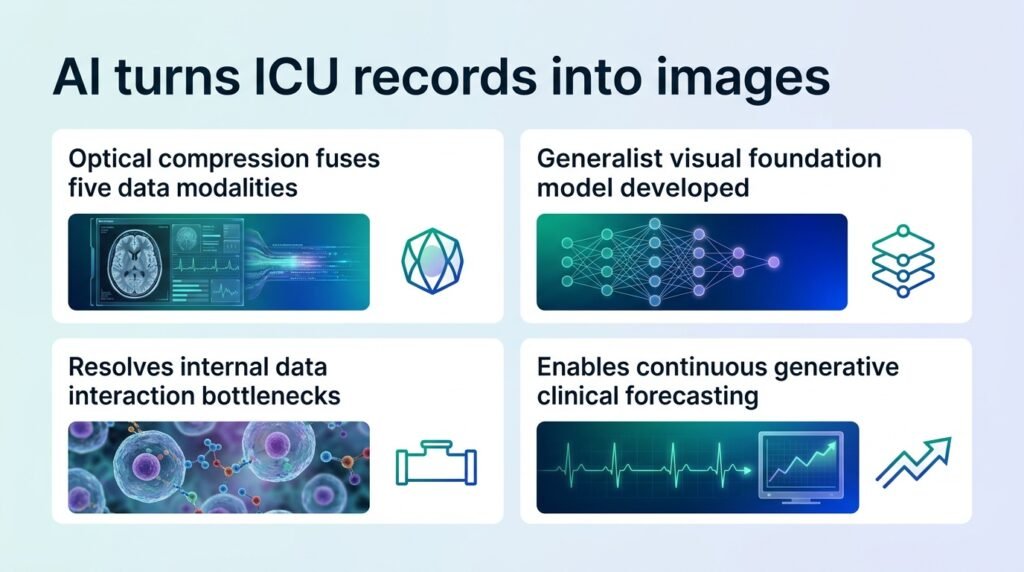
A new model bypasses complex data integration by flattening medical notes, scans, and heart rhythms into a single visual map.
How do you get an AI to read a chest X-ray, a doctor’s handwritten note, and a live heart monitor all at once? Usually, engineers build separate, highly specialized models for each task and try to stitch them together. This patchwork approach often fails in fast-moving intensive care units where data formats are messy and fragmented.
A new study suggests we should stop trying to translate these different data types. Instead, we should just take pictures of them. By treating clinical data as pixels rather than code, researchers are challenging the prevailing belief that multimodal AI needs complex, hand-crafted fusion architectures.
Ditching the text parser
The researchers built their “Clinical Visual Memory” using MIMIC-IV data from 54,551 adult ICU patients, covering 68,546 admissions and 74,829 ICU stays. They turned structured medical records, vital signs, 10-second ECGs, chest X-rays, and clinical notes into 2D images. A single frozen vision transformer then compressed these images into a 1024-dimensional visual memory.
This approach bypasses the traditional data-integration bottleneck. It suggests that vision models do not need to understand medical concepts natively to recognize visual patterns across a unified canvas. The AI simply looks at the combined image of a patient’s chart and forecasts what will happen next.
Strong predictive performance
The model performed remarkably well across several critical ICU milestones. The system achieved the following results:
- An AUROC of 0.852 for predicting mortality within 48 hours.
- An AUROC of 0.699 for predicting acute kidney injury.
- An AUROC of 0.723 for predicting high organ failure scores.
- An AUROC of 0.742 for predicting live discharge from the ICU.
The real surprise is how little data the model actually needs to work. When researchers shrunk the retained source-pixel area to just 1%, the model still preserved 98.9% of its accuracy for 48-hour mortality. This extreme compression means the system can run without heavy computing power.
Fewer false alarms
This efficiency translates directly to clinical utility. The system generated proactive warnings with median lead times of 34.8 hours before death and 14.6 hours before kidney injury. Crucially, it did this with a low false-alert rate of 0.040 to 0.109 alarms per patient-day, which could help prevent alarm fatigue in busy wards.
This visual-first approach could redefine how hospitals deploy predictive software. Instead of maintaining massive, expensive pipelines to parse text and waveforms separately, hospitals might run a single image-based processor. It shifts the paradigm from reactive alerts to continuous, visual forecasting.
However, we must look at the limitations. This was a retrospective study on a single database, and the model has only undergone internal validation. Before doctors can trust these visual maps, the system must prove it can handle the non-standardized data of a real-world hospital. But as a proof of concept, it shows that the easiest way to integrate complex data may be to simply look at it.
Read the full preprint on medRxiv.