
By combining basic blood markers with machine learning, clinicians can now spot metabolic wasting in kidney failure patients before severe physical decline takes hold.
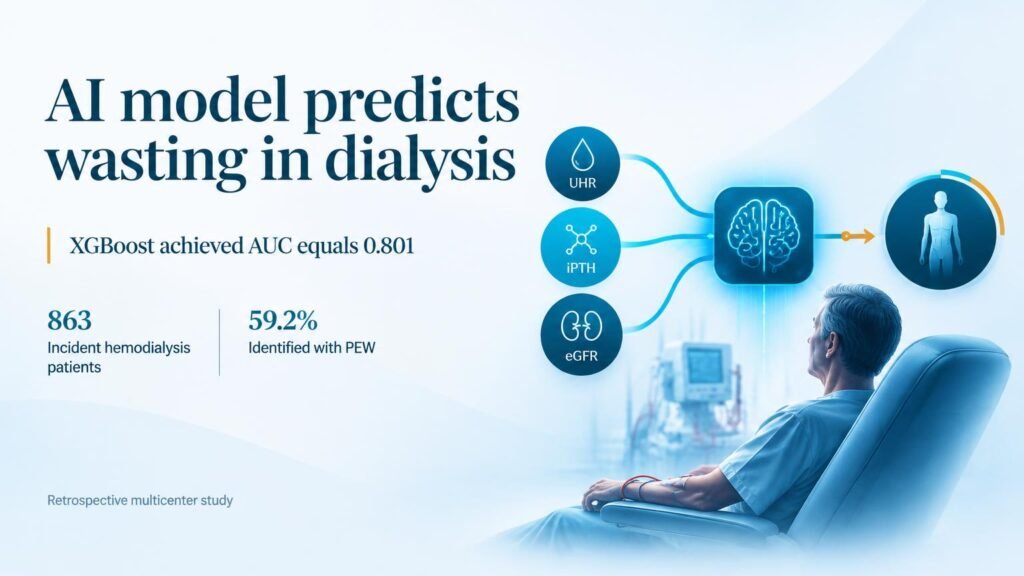
Over half of new hemodialysis patients suffer from protein-energy wasting, a metabolic drain that drastically shortens survival. Yet clinics often miss early warning signs because standard screens fail to catch subtle metabolic shifts. A new multicenter analysis suggests that tracking two routine blood metrics—the uric acid to HDL-cholesterol ratio (UHR) and intact parathyroid hormone (iPTH)—can reliably flag vulnerable patients before severe muscle loss sets in.
This finding complicates traditional assumptions about metabolic risk in renal care. High uric acid is usually treated as a cardiovascular hazard, but in new dialysis cases, higher baseline levels appear to reflect better nutritional reserves. While earlier risk calculators relied on static laboratory snapshots, as seen in earlier PEW modeling work, tracking metabolic trajectories provides a far clearer picture of individual vulnerability.
Key diagnostic findings
In a retrospective multicenter cohort of 863 incident hemodialysis patients, researchers evaluated ten machine learning algorithms alongside traditional regression to map wasting patterns. Feature selection across four separate analytical approaches consistently isolated the same key drivers.
- Protein-energy wasting was present in 59.2% of patients at dialysis initiation.
- Feature selection consistently identified UHR, iPTH, and eGFR as the primary risk factors.
- The XGBoost algorithm achieved the highest predictive performance, reaching an AUC of 0.801.
- Mediation analysis revealed that iPTH accounts for 10% to 13% of the association between UHR and wasting risk.
Nonlinear biological signals
The relationship between these biomarkers and patient risk is surprisingly complex. The analysis identified an inverted U-shaped curve for UHR and an S-shaped curve for intact parathyroid hormone, meaning risk rises and falls within specific biological windows rather than along a straight line.
That non-linear pattern is why standard risk scores often fail. Advanced algorithms, like the explainable software frameworks discussed in recent nephrology research, handle these curved relationships much better than human spot-checks. To make the findings actionable, the authors translated their XGBoost model into an interactive Shiny web application for bedside risk estimation.
A tool’s predictive accuracy is not the same as a clinical intervention. Retrospective performance on 863 patients shows the model calculates risk well, but it does not prove that automated alerts will lower patient mortality or reduce nursing workload. Until prospective trials confirm that acting on these scores improves clinical outcomes, the web app functions as a screening aid rather than a substitute for clinical judgment.
Read the full study in Renal Failure.