
Sepsis patients split into four distinct risk groups
A new study shows that tracking dynamic organ trajectories can identify high-risk sepsis patients before they crash, challenging the standard one-size-fits-all treatment model.
Sepsis treatment often fails because clinicians treat it as a single, static disease. By the time a patient’s kidneys or heart fail, the window for optimal intervention has already closed. A new analysis of patient data reveals that tracking how cardiovascular, renal, and metabolic systems interact over 120 hours exposes hidden trajectories of decline.
This challenges the traditional reliance on static clinical scores. Instead of waiting for obvious organ failure, clinicians must look at the rate of change across multiple systems. The study proves that patients who look moderately ill at first can suddenly deteriorate if their metabolic and organ trends align negatively.
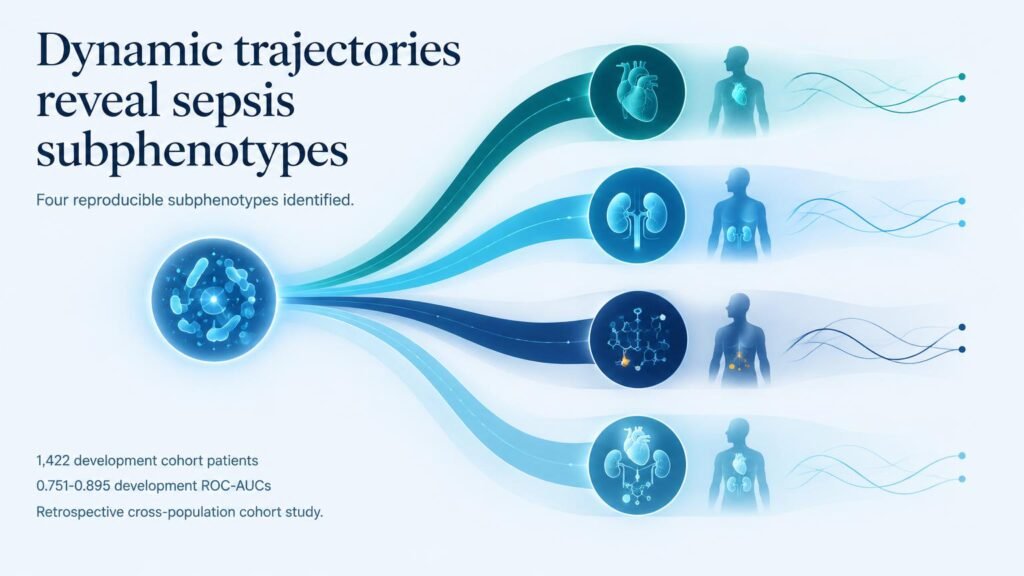
Researchers analyzed data from 1,422 adult sepsis patients in the MIMIC-IV database. They validated these findings using external data from MIMIC-III and the Fuzhou University Affiliated Provincial Hospital. By modeling the 120-hour trajectories of the triglyceride-glucose (TyG) index, cardiovascular SOFA scores, and renal SOFA scores, they identified four distinct patient subphenotypes.
Four distinct sepsis paths
- Phenotype A: Started with moderate severity but suffered rapid, synchronized decompensation, yielding the highest 30-day mortality (adjusted HR 1.82 compared to Phenotype C).
- Phenotype D: Characterized by sustained organ dysfunction and metabolic dysregulation, with an adjusted HR of 1.45 compared to Phenotype C.
- Phenotypes B and C: Exhibited mild-to-moderate dysfunction, with lower 30-day mortality rates of 27.7% and 22.7% respectively.
- Machine learning prediction: Algorithms like LightGBM and XGBoost predicted the high-risk Phenotype A with an ROC-AUC of 0.751 to 0.895 in the development cohort and 0.717 to 0.762 in external validation.
Why this finding matters
This is not about generic risk scoring. The real clinical value lies in fluid management. The study found that early fluid administration had wildly different impacts on mortality depending on the patient’s subphenotype. Giving fluids blindly to a Phenotype A patient might cause harm, while Phenotype C patients might benefit. This suggests that standardized fluid protocols may actively harm certain subgroups.
The limits of retrospective data
However, we must be cautious. This is a retrospective study, meaning these algorithms have not been tested in real-time clinical workflows. The drop in predictive accuracy during external validation (down to an AUC of 0.717) suggests that local hospital data variations can degrade the model’s performance.
Clinicians should not immediately change their fluid protocols based on these models. Instead, the immediate takeaway is to monitor the TyG index and blood urea nitrogen together. These two markers, alongside the Charlson Comorbidity Index, served as the strongest early warning signs for the lethal Phenotype A trajectory.
Read the full study in BMC Medical Informatics and Decision Making.