A new machine-learning model spots lung cancer from a simple urine sample, challenging the current reliance on costly scans and invasive blood draws.
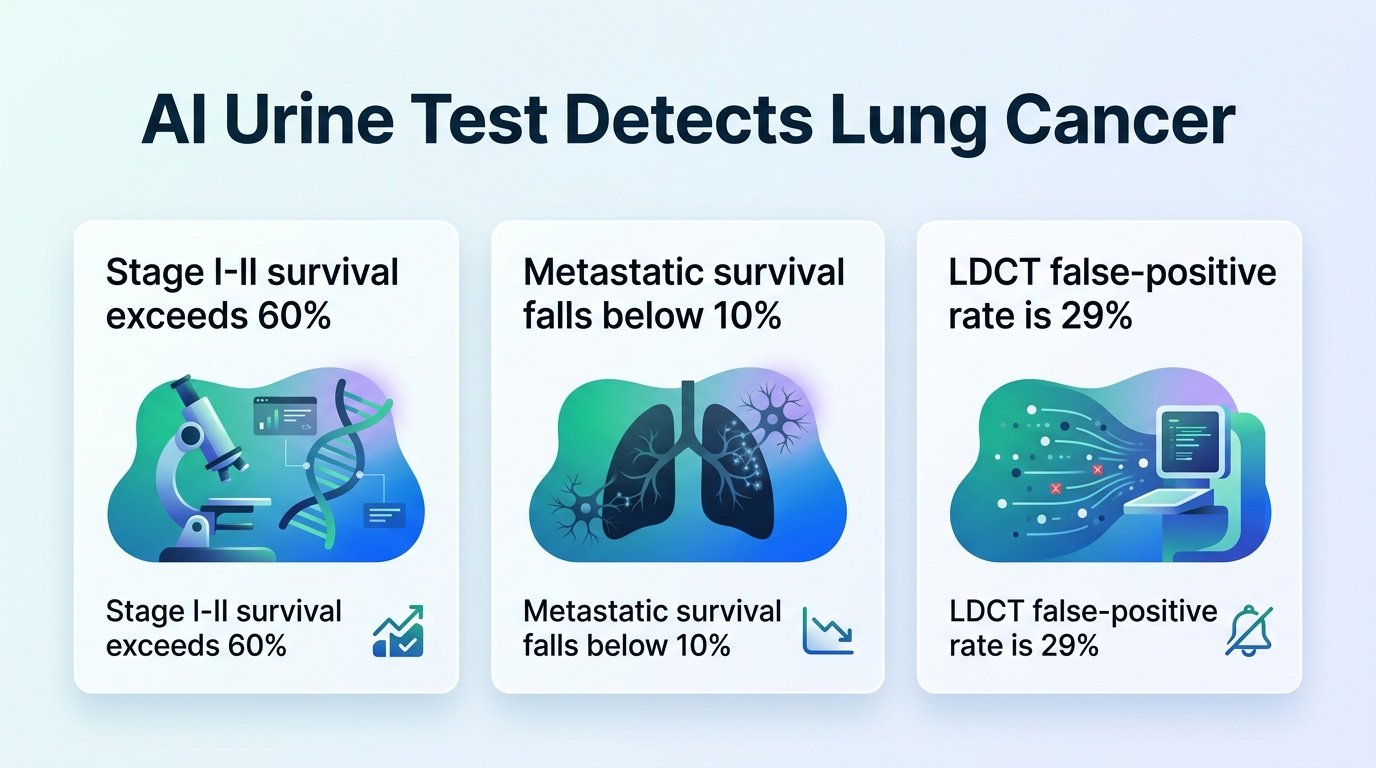
Why do we wait for lung cancer to spread before we find it? Five-year survival exceeds 60% at stage I-II, but crashes below 10% once metastasis occurs. Yet, our best screening tool, low-dose CT imaging, misses never-smokers entirely and carries a staggering 29% false-positive rate.
This diagnostic gap is where liquid biopsies are supposed to step in. But while the industry has poured billions into blood-based assays, urine has remained an underutilized resource. A newly validated machine-learning index suggests we might be looking for biomarkers in the wrong fluid. By focusing on metabolic waste rather than circulating tumor DNA, this tool offers a cheaper, non-invasive triage option that could redefine who gets screened.
How the model works
Researchers built the urinary-metabolite-based lung cancer index (uLCI) using a Lasso-regularized logistic regression model. It integrates four specific urinary metabolites—creatine riboside, N-acetylneuraminic acid, 27-nor-5β-cholestane-3,7,12,24R,25S-pentol, and cortisol sulfate—with three basic clinical variables: age, race, and smoking history.
The model was trained using the NCI-Maryland development cohort, which included 845 individuals: 470 controls and 375 cases across stages I-IV. To test its real-world viability, researchers applied the locked model without any refitting to the independent Colorado Lung Cancer Cohort, which consisted of 488 individuals, including 211 controls and 277 cases.
The validation drop
The model’s performance reveals a classic machine-learning hurdle: the real-world performance drop. While the index performed exceptionally well in its training cohort, its accuracy fell when tested on the geographically distinct validation group. Key findings from the study include:
- An Area Under the Curve (AUC) of 0.906 in the Maryland cohort, which dropped to 0.748 in the Colorado validation cohort.
- Stage-specific discrimination ranging from 0.900 to 0.927 in Maryland, and 0.722 to 0.843 in Colorado.
- A net reclassification improvement over clinical variables of 1.24 in the development group and 0.74 in the validation group.
- A Spearman correlation of 0.69 and 0.45 (both p<0.0001) showing scores rose consistently across cancer stages.
- An adjusted hazard ratio of 2.03 for predicting post-resection survival in stage I-II disease.
The real-world limits
The drop in validation performance from 0.906 to 0.748 is the critical detail. It proves that metabolic signatures are highly sensitive to regional, dietary, and demographic differences. If a tool cannot maintain its accuracy across different states, its clinical utility remains limited.
Even with this drop, the index’s estimated false-positive rate of 17% to 19% still beats the 29% rate of low-dose CT scans and the 27% rate of blood-based assays. This tool is not an imaging replacement. Instead, it should be viewed as a low-cost filter to identify high-risk patients, including never-smokers who are usually locked out of standard screening. Before this clinical tool can be deployed, it must undergo prospective testing in larger biobanks to see if these metabolic signals hold up in the general population.
Read the full preprint study on medRxiv.